2-m27-49_en 34 / 34
10秒後にBOOKのページに移動します
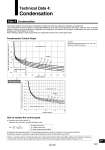
In pneumatic systems, the generation of waterdrops in piping may affect the equipment’s operation and service life. Thus, compressed air that is supplied is normally dehumidified by an air dryer, and is then sent to the system. However, when a compact actuator is used in order to downsize the equipment and correspond to the demand of high speed, condensation may occur and cause damage even if dehumidified air is used. When selecting cylinders, check the generation of condensation based on the control graph below. Data 4 Condensation How to analyze the control graph Refer to a separate catalog, “Condensation Measures of Pneumatic Systems” (Refer to the SMC website.) for the details of measures. Condensation control can also be determined based on SMC’s Pneumatic Equipment Model Selection Program Ver. 3.5. (1) Determine the volume ratio Kv . Determine the volume Kv using the following formula. Kv = .. x .... (2) Determine the intersection point w of the atmospheric pressure dew point of supply air q and volume ratio Kv e. (3) Determine whether condensation is generated depending on where the intersection point w falls. Vt Vc 0.1 Ps + 0.1 Vt: Piping volume [cm3] Vc: Cylinder volume [cm3] Ps: Supply air gauge pressure [MPa] Conditions Solenoid vale switching interval: ON 1 sec., OFF 1 sec. Piping tube material: Polyurethane Enlarged view -50 -45 -40 -35 -30 -25 -20 -15 -10 -5 0 0 5 10 15 20 Volume ratio Kv Inlet air: Atmospheric pressure dew point °C Ps [MPa] Condensation zone None-condensation zone 0.7 0.6 0.5 0.4 -60 -50 -40 -30 -20 -10 0 0 20 40 60 80 100 120 140 160 Volume ratio Kv Inlet air: Atmospheric pressure dew point °C Condensation zone None-condensation zone 0.4 0.5 0.6 0.7 Ps [MPa] Condensation Control Graph Technical Data 4: Condensation 1827 Technical data