2-m27-49_en 13 / 34
10秒後にBOOKのページに移動します
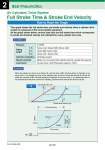
2 Best Pneumatics Air Cylinders’ Drive System Full Stroke Time & Stroke End Velocity How to Read the Graph This graph shows the full stroke time and stroke end velocity when a cylinder drive system is composed of the most suitable equipment. As the graph shown below, various load ratio and full stroke time which corresponds to stroke and terminal velocity are indicated for every cylinder bore size. When the cylinder bore size is o, its stroke is L, and load ratio is d%, full stroke time t is obtainted, as an arrow mark q, by reading the value on the abscissa over the point at which the ordinate L hits the full stroke line (red line) of d%. Terminal velocity u is obtained, as an arrow mark w, by reading the value on the abscissa below the point at which the ordinate L hits the terminal velocity line (blue line) of d%. Pressure Cylinder orientation Speed controller Load factor Piping length 0.5 MPa Series CJ2, Series CM2, Series CQ2 Series MB, Series CQ2 Series CS1, Series CS2 Vertically upward Meter-out, connected with cylinder directly, needle fully opened ((Load mass x 9.8)/Theoretical output) x 100% 1 m 2 m 3 m Conditions Example o Full stroke time (t ) Stroke end velocity (u) Stroke (L) Full stroke time Stroke Speed Time (sec) (mm) SOL. ON OFF Stroke Stroke end velocity q w d% d% Front matter 38